Chart Builder
Chart Builder an Open Source HTML5 tool based on PHP code
Create your first Chat with this great Tool and generate PHP code for your application
Chart Builder is an Open Source HTML5 based Tool. Create your first PHP Chart with this great Tool which is an Open Source HTML5, a PHP based application built in Apache + PHP + MySQL + Free Charting Engine, which is designed with simplicity and ease-of-use at top of the mind which is customizable in a number of ways. It supports a variety of different charts, and can be used to create either static or real-time dashboards with data coming from a variety of sources such as MySQL, MS SQL, SQLite, ORACLE, PostgreSQL, Sybase and Cubrid with no programming skills. A part of the community, This Chart Builder is designed to integrate with a PHP application you may already be using.
Figuring out how to best visualize your data can be challenging. Maybe you started out by creating a few graphs in a spreadsheet and are trying to find a way to tie them all together. Or maybe you’re working with an existing analytics tool and want to find a way to make your data more accessible to a wider audience. Or perhaps you’ve gone several real-time sources and are trying to find a way to tie them all together.
Fortunately, there is a PHP based Open Source HTML5 Chart Builder is available that make the job much easier. On one end of the spectrum are community application, like BIRT or Pentaho. But for a smaller project, tools like these could be overkill, and in some cases, you might be able to find a dashboard tool that is already designed to work with the kind of data you are dealing with.
Requirements
- PHP Version 5.6 or later
- Apache 2 or later
- Windows 7 or later /Linux 3 or later
- Firefox 52, Chrome 57, IE 8
Installation
- Download from https://dashboardbuilder.net/download-free-dashboard
- Place the files in a directory on the web server. e.g. …/www/dashboar/dbuilder/
- Unzip the file using Extract Here option to the root folder of “dashboardbuilder”
Build your first Chart
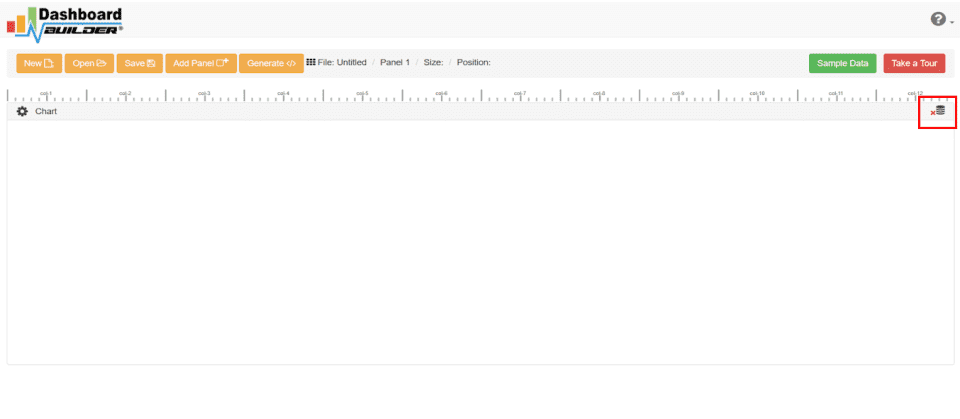
- Run the web folder in your browser. e.g. http://localhost/dashboarduiler following welcome screen will appear.
- Now Click the Database icon.
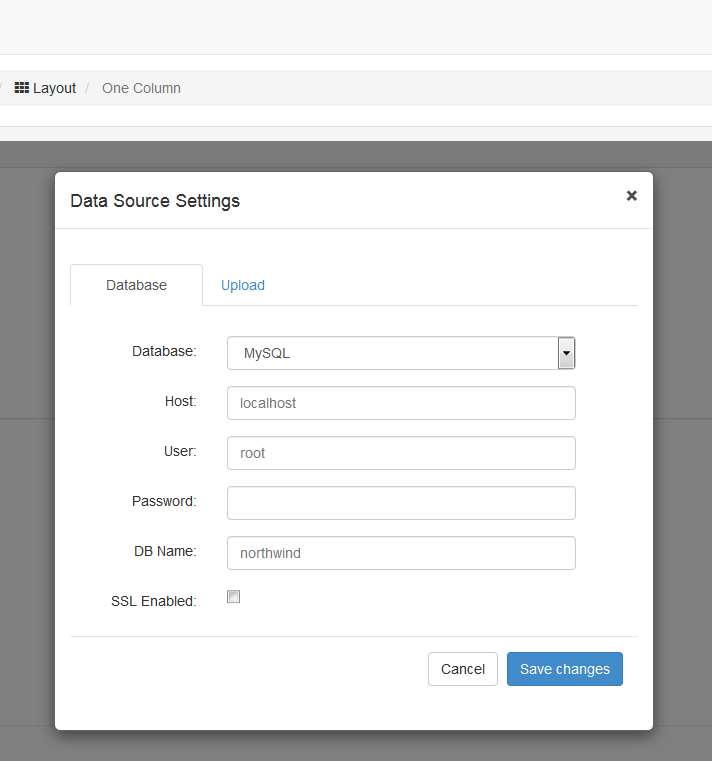
- Following screen will appear. Select Database from data source tab. Select SQLite from the drop down list of Database, Enter your ‘’../data/Northwind.db’’ in the DB name field and
Save changesas mentioned in the screen.
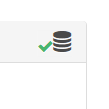
- A green tick mark with Database will appear when your database is successfully connected.
- Select the gear icon for your Chart preference.
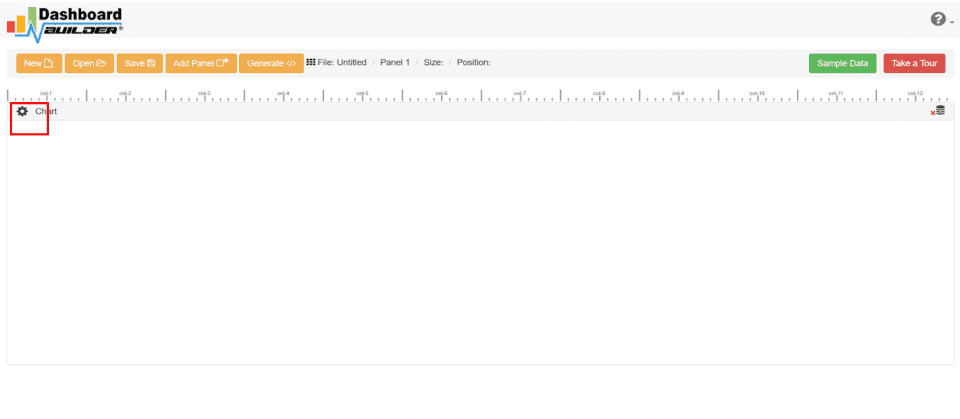
- The following screen will appear. List of the tables will appear.
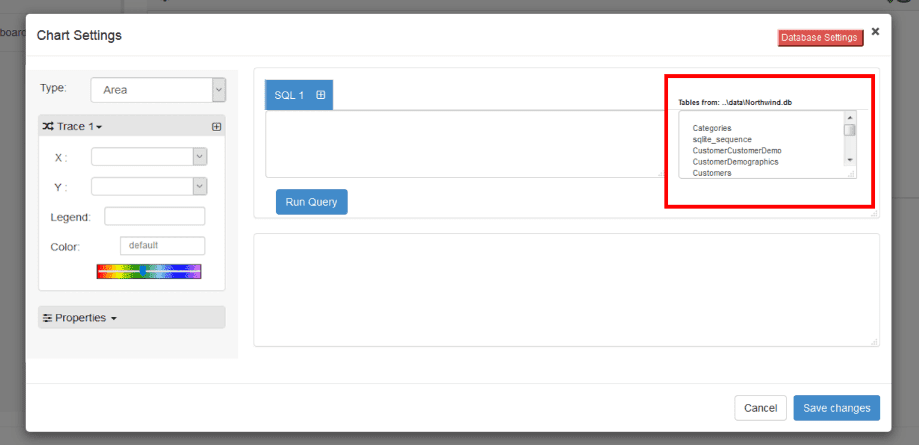
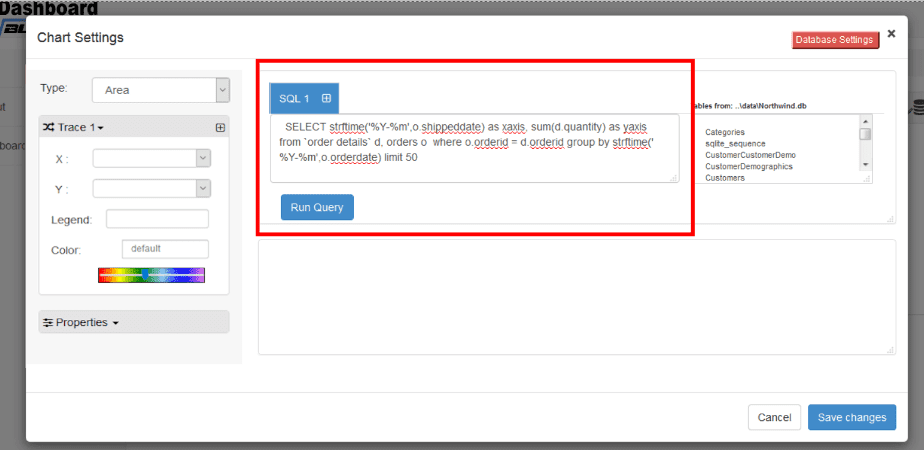
- Enter your SQL statement in text box, SQL field as the following manner
SELECT strftime(‘%Y-%m’,o.shippeddate) as xaxis, sum(d.quantity) as yaxis from ‘order details’ d, orders o where o.orderid = d.orderid group by strftime(‘%Y-%m’,o.orderdate) limit 50
- Click the
Run Querybutton
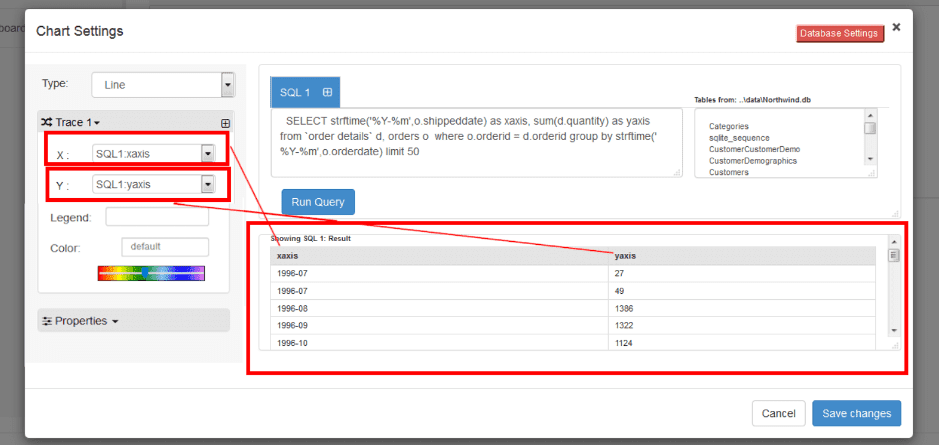
- Query Result will appear. Now Select your x-axis data from the drop down list of
Xand y-axis data from the drop down list ofY. - Click
Save Changes
- Charts will be appeared on the screen as shown below.
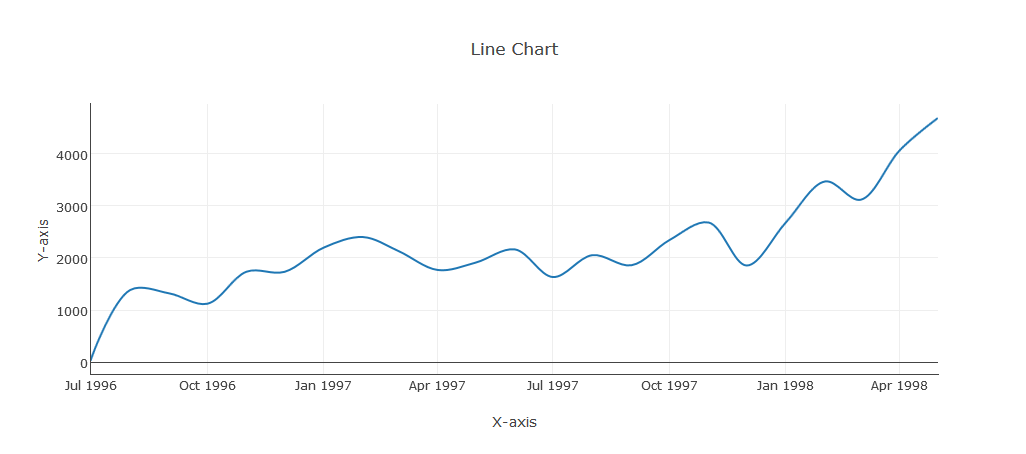
- Now extend the
Generatebutton and click on thePHP Code
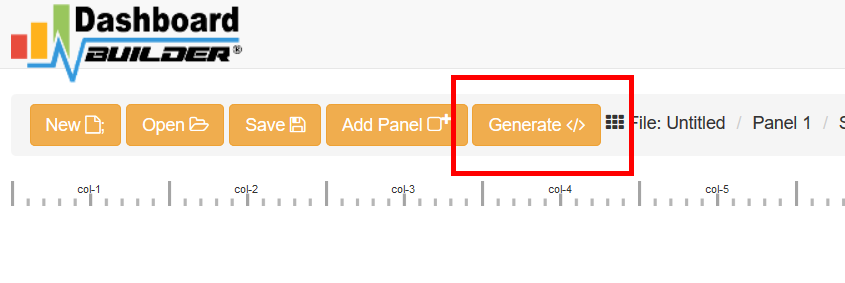
- PHP code for the chart will automatically generate, you may copy past this code to your PHP application.
PHP Code
/**
 * DashboardBuilder
 *
 * @author Diginix Technologies www.diginixtech.com
 * Support  - http://www.dashboardbuilder.net
 * @copyright (C) 2018 Dashboardbuilder.net
 * @version 2.1.7
 * @license: license.txt
 */

include("inc/dashboard_dist.php");  // copy this file to inc folder


// for chart #1
$data = new dashboardbuilder();
$data->type =  "line";

$data->source =  "Database";
$data->rdbms =  "sqlite";
$data->servername =  "";
$data->username =  "";
$data->password =  "";
$data->dbname =  "data\Northwind.db";
$data->xaxisSQL[0]=  "SELECT strftime(^%Y-%m^,o.shippeddate) as xaxis, sum(d.quantity) as yaxis from `order details` d, orders o  where o.orderid = d.orderid group by strftime(^%Y-%m^,o.orderdate) limit 50";
$data->xaxisCol[0]=  "xaxis";
$data->yaxisSQL[0]=  "SELECT strftime(^%Y-%m^,o.shippeddate) as xaxis, sum(d.quantity) as yaxis from `order details` d, orders o  where o.orderid = d.orderid group by strftime(^%Y-%m^,o.orderdate) limit 50";
$data->yaxisCol[0]=  "yaxis";
$data->name = "linechart";
$data->title = "Line Chart";
$data->orientation = "";
$data->xaxistitle = "x-axis title";
$data->yaxistitle = "y-axis title";
$result[0] = $data->result();

?>

<!DOCTYPE html>
<html>
<head>
	<script src="assets/js/dashboard.min.js"></script> <!-- copy this file to assets/js folder -->
	<!--<link rel="stylesheet" href="assets/css/bootstrap.min.css"> Bootstrap CSS file, change the path accordingly -->


</head>
<body>

<div class="container">
<div class="col-lg-12">
<div class="panel panel-default">
<div class="panel-heading"></div>
    <div class="panel-body">
        <?php echo $result[0];?>
    </div>
</div>
</div>
</div>
</body>